Whether we’re talking about the rise of social shopping, the role of AI in ecommerce, mobile buying habits, or the real reasons shoppers abandon carts, the story of modern ecommerce is one of scale, speed, and constant reinvention.
So, in this ecommerce statistics roundup, I’ve pulled together the most important facts and figures shaping that story — read on as I cover global market trends, U.S. ecommerce performance, platform share, mobile commerce, fraud, dropshipping economies…and much more.
Important note: you are free to cite any of the ecommerce stats or use any of the graphs featured in this post in your own articles. However, we request that you credit Ecommercetrix as a source and link to this post when doing so. Thank you!
Article highlights
- What does global ecommerce look like?
- Which models and markets are growing fastest?
- How much do shoppers spend per visit?
- How strong is U.S. ecommerce?
- Which platforms and marketplaces are most popular?
- How big is social commerce?
- What’s happening in mobile ecommerce?
- Why do shoppers abandon carts?
- How widespread is ecommerce fraud?
- Is dropshipping and POD still profitable?
- How much is AI used in ecommerce?
- Where is ecommerce heading next?
What does the global ecommerce landscape look like right now?
Global ecommerce is continuing its upward surge — but the growth isn’t evenly distributed. Some regions are accelerating at breakneck speed, while others are expanding more gradually. Asia, in particular, now shapes much of the global ecommerce story, with China acting as the engine behind both user growth and overall market volume.
Here’s how the landscape looks today:
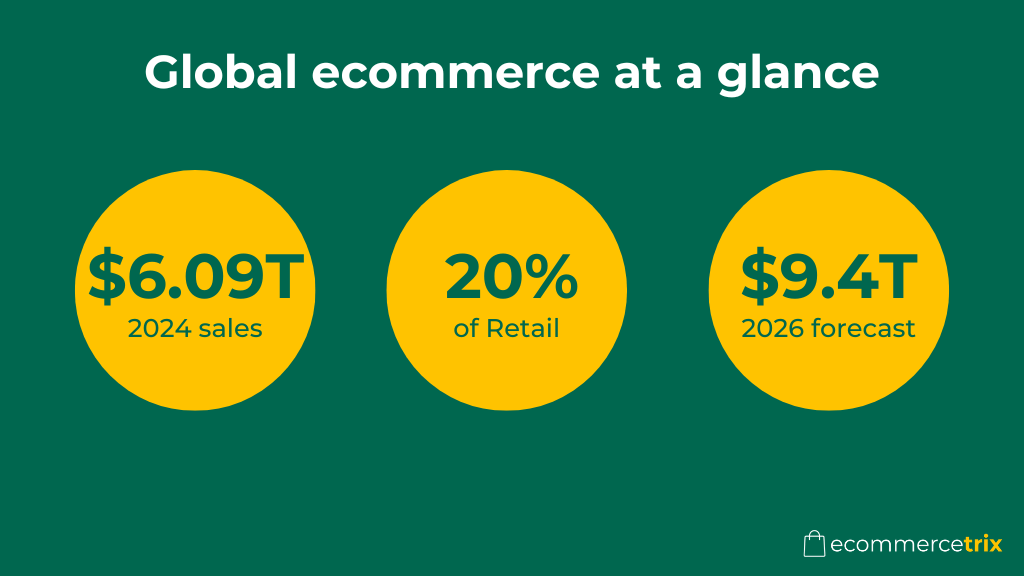
- Global retail ecommerce sales in 2024 amounted to $6.09 trillion — roughly 20% of all retail spending. (Source: Shopify.)
- Worldwide ecommerce revenue is projected to reach $9.4 trillion by 2026. (Source: Statista.)
- Asia is the world’s largest ecommerce region, with nearly $2 trillion spent on online purchases in 2024 — about $500 billion more than the Americas. (Source: Statista.)
- China generated $1.47 trillion in ecommerce revenue in 2024, accounting for 52.1% of the global ecommerce market. (Source: Statista.)
- There are 904 million Chinese digital shoppers today (44% of the global total); this will rise to 1.33 billion by 2027. (Source: Statista.)
- China leads the world in ecommerce penetration, with 46.3% of all its retail sales occurring online. (Source: Insider Intelligence.)
- The global ecommerce ecosystem is made up of 26.5 million ecommerce sites. (Source: Doofinder.)
The data paints a clear picture: ecommerce is now a truly global retail force — but China and Asia are setting the pace for growth, innovation, and sheer market scale.
Which ecommerce models and markets are growing fastest?
Ecommerce continues to branch into new business models, but two categories still drive the bulk of global activity: B2C (business-to-consumer), and B2B (business-to-business).
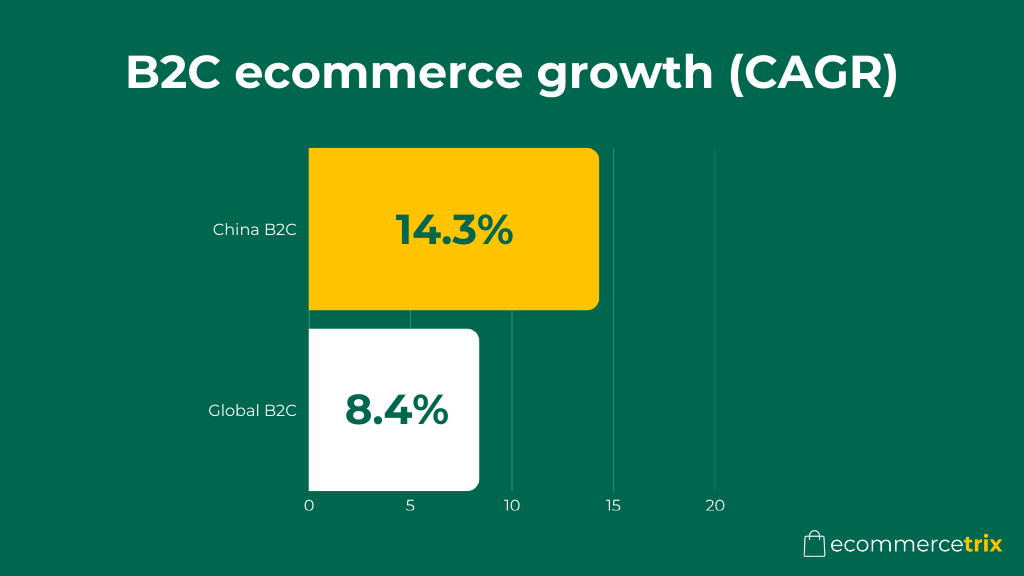
- B2C ecommerce is projected to grow at a CAGR of 8.4% from 2020 to 2027. (Source: Research and Markets.)
- China’s B2C sector is expanding even faster, with a forecast 14.3% CAGR, underscoring the country’s role as a global ecommerce engine. (Source: Research and Markets.)
- B2B ecommerce, meanwhile, dwarfs the consumer market in scale — it’s on track to account for $47.54 trillion in sales by 2030, cementing its status as the dominant force in online commerce. (Source: TechSci Research.)
Growth is also unevenly distributed across global regions:
- Six of the world’s ten fastest-growing ecommerce markets are in Asia, led by the Philippines (24.1% growth), India (22.3%) and Indonesia (20%). (Source: Statista.)
- The UK remains one of the most online-driven retail economies, with ecommerce accounting for 36.3% of all national retail sales. (Source: Insider Intelligence.)
The data shows a landscape where ecommerce demand is rising everywhere — but accelerating fastest in Asia and in the massive, often overlooked B2B sector.
How much do online shoppers spend per visit?
When you dig into the data, the average value of an ecommerce visit is much lower than many merchants imagine — largely because most visits don’t turn into purchases. This makes visit value a useful indicator of traffic quality, but a poor reflection of actual revenue generation.
Across the board, the numbers look like this:
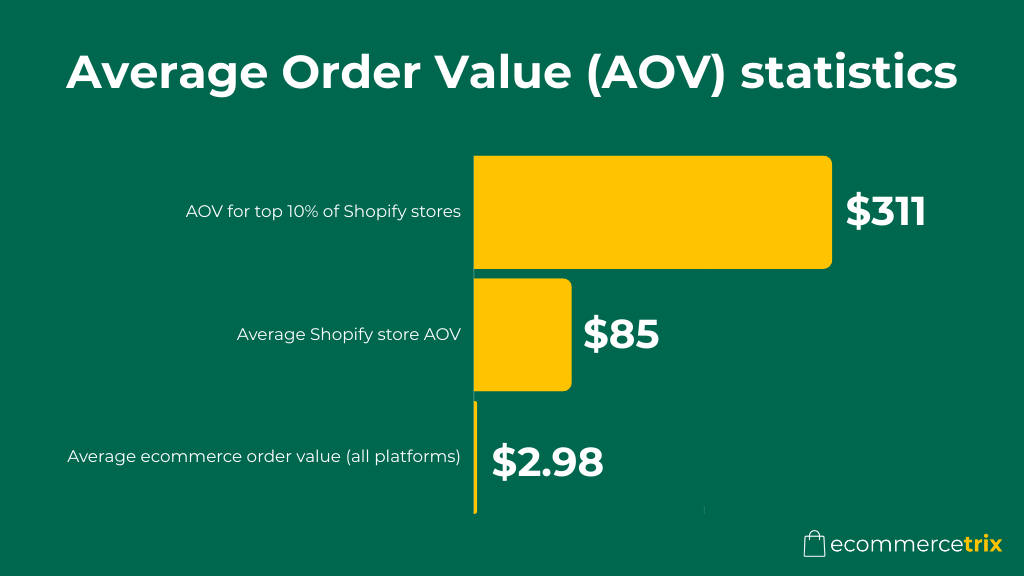
- $2.98 — the average spend per visit in Q2 2025. (Source: Statista.)
- $3.02 — the average spend for the highest-performing category, Health & Beauty. (Source: Statista.)
- $2.66 — the average spend for home appliances, the next strongest category. (Source: Statista.)
However, these figures only tell part of the story. When shoppers do convert, the economics shift dramatically — and that’s where average order value (AOV) becomes a far more meaningful performance measure:
- $85 — the typical AOV for a Shopify store. (Source: Littledata.io.)
- $192 — the AOV for the top-performing 20% of Shopify merchants. (Source: Littledata.io.)
- $311 — the AOV for the top 10% of Shopify stores. (Source: Littledata.io.)
The message is clear: while individual visits generate very little revenue on their own, high-intent buyers still spend solid amounts — so optimizing your store’s conversion rate and AOV will have a far greater impact on revenue than visit-level metrics alone.
How strong is the U.S. ecommerce market?
The U.S. ecommerce sector continues to expand at a healthy pace — and remains one of the most competitive, platform-driven retail environments in the world. Growth is steady rather than explosive, but the sheer scale of the market and the dominance of a few major players make it a key bellwether for global online retail trends.
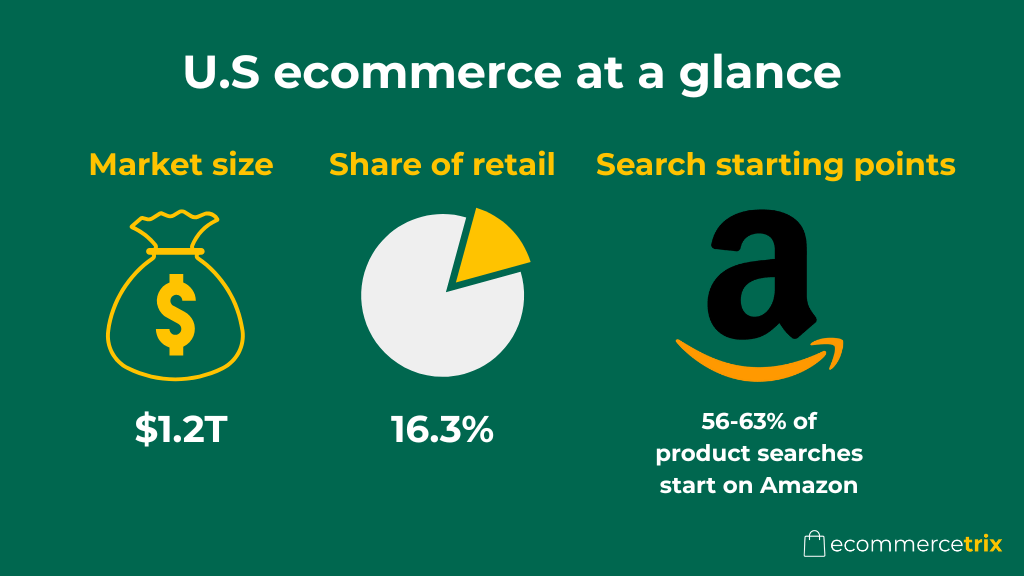
- U.S. ecommerce sales reached $1.2 trillion in 2024, a 9.8% increase on the previous year. (Source: Fit Consulting.)
- In Q2 2025, online sales hit $304.2 billion, accounting for 16.3% of all retail activity. (Source: PYMNTS Intelligence.)
- Annual U.S. ecommerce sales totaled $1.1 trillion in 2023, up 7.6% from 2022 — continuing a multi-year upward trajectory. (Source: US Census Bureau.)
- Amazon remains the primary discovery channel for online shopping, capturing 56%–63% of first-touch product searches. Google follows with 33%–49%, while Walmart is gaining ground with 20%–32%. (Source: eMarketer, Jungle Scout 2024, CivicScience retail search surveys.)
- In terms of revenue, Amazon is far ahead of the pack: it generated $492.2 billion in U.S. ecommerce sales in 2024, compared with $94.1 billion for Walmart and $41.7 billion for Apple. (Source: Oberlo.)
- Looking ahead, U.S. ecommerce is expected to grow at an average annual rate of 7.8% from 2023 to 2027. (Source: ecommerce DB.)
Overall, the U.S. market is maturing rather than slowing — with consistent year-over-year gains and a competitive landscape shaped heavily by Amazon’s continued dominance.
Which ecommerce platforms and marketplaces are most popular?
The ecommerce ecosystem is increasingly dominated by a small group of platforms and marketplaces, each shaping online retail in very different ways. On the platform side, merchants lean toward flexible site builders like Shopify and WooCommerce; on the marketplace side, Amazon, Alibaba and Pinduoduo command extraordinary global reach.
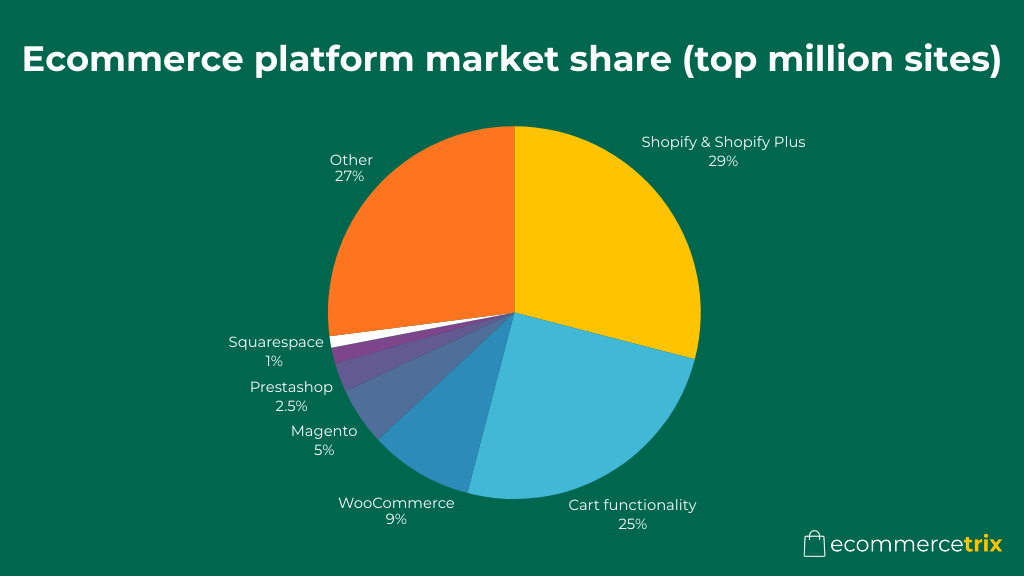
- Among the world’s top 1 million sites, Shopify leads with 29% usage, making it the most popular high-end ecommerce platform. (Source: Builtwith.)
- WooCommerce powers 9% of the top 1M but holds the largest overall platform market share: 39% of all ecommerce sites. (Source: Builtwith.)
- Squarespace maintains a significant footprint too, accounting for 14.75% of global ecommerce sites. (Source: Statista.)
- In the U.S., Shopify is particularly strong, with 28% of the platform market among the top one million ecommerce sites. (Source: Builtwith.)
- WordPress users overwhelmingly gravitate toward WooCommerce — it powers 91% of all WordPress-based ecommerce stores. (Source: Builtwith.)
(You can learn more about some of these platforms in our in-depth Shopify review, our Wix review, our Squarespace review, and our Shopify vs Squarespace comparison.)
On the marketplace side, the picture is even more concentrated:
- Amazon is the world’s largest marketplace by market capitalization ($2.449 trillion), followed by Alibaba ($376.03B) and Pinduoduo ($164.39B). (Source: Companies Market Cap.)
- Alibaba has the most active customers — 903 million, almost three times Amazon’s 310 million. (Sources: Statista.)
- When it comes to engagement, Amazon dominates again: it receives 2.77 billion monthly visits — more than 5 times eBay’s 543 million. (Source: Semrush.)
These numbers highlight how a handful of platforms and marketplaces account for the vast majority of ecommerce activity — and that Amazon and Shopify continue to set much of the industry’s direction.
How big is social commerce becoming?
Social commerce is evolving from a discovery channel into a fully fledged shopping ecosystem — and the numbers show just how quickly that shift is happening. With billions of users and increasingly seamless in-app purchasing, social platforms are becoming some of the most influential retail environments in the world.
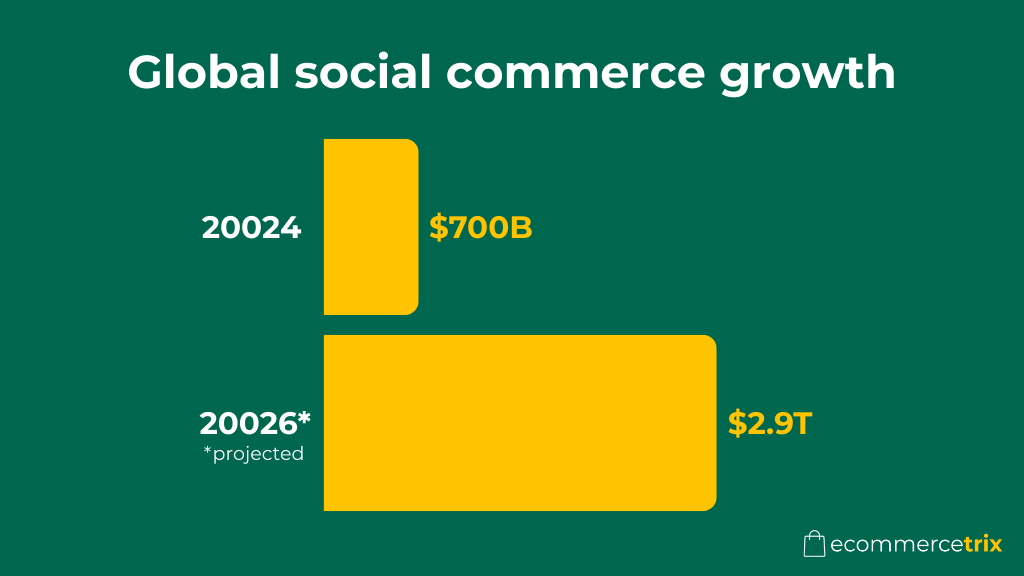
- Global social commerce sales reached $700 billion in 2024, with forecasts pointing toward $2.9 trillion in the years ahead. (Source: Statista.)
- There are now 5.2 billion social media users globally — a figure expected to grow to 5.8 billion by 2027. (Source: Datareportal.)
- 9 in 10 social media users purchase from brands they follow, underscoring the commercial power of community and content. (Source: Marketing Dive.)
- 46% of Chinese and 36% of American users regularly buy directly through social platforms. (Source: Statista.)
- In the U.S., social commerce sales doubled between 2020 and 2022, rising from $26.9B to $56B. (Source: Insider Intelligence.)
TikTok continues to be the standout driver:
- 20.6% of TikTok users say they buy through the app “all the time.” (Source: Insider Intelligence.)
- The #TikTokMadeMeBuyIt hashtag has attracted 29.1 billion views, turning viral shopping into a cultural norm. (Source: Insider Intelligence.)
China’s livestream economy shows the future direction of travel:
- China’s livestream commerce market hit nearly 5 trillion yuan in 2023. (Source: Statista.)
- Douyin saw a 40× increase in transaction value between 2019 and 2022 — an indication of how quickly livestream shopping can scale. (Source: Statista.)
These trends make one thing clear: social platforms are no longer just where shopping journeys begin — they’re increasingly where they end, too.
What’s happening with mobile ecommerce?
Mobile commerce continues to shape how people shop online — it drives the majority of ecommerce traffic and an increasing share of sales. But while mobile usage keeps climbing, conversion rates still trail behind desktop — suggesting plenty of room for optimization.
- Mobile now accounts for 71% of all ecommerce site traffic. (Source: SaleCycle.)
- Conversion rates remain lower on phones: 2% on mobile vs 3% on desktop. (Source: Statista.)
- 79% of mobile users made a purchase on their phone between July and December 2022, highlighting the role of mobile in everyday shopping. (Source: OuterBox.)
- In the U.S., 65% of ecommerce sales are now mobile-driven. (Source: Insider Intelligence.)
- Globally, mobile is responsible for 43.4% of all ecommerce sales in 2024. (Source: Insider Intelligence.)
Payments are shifting heavily toward digital wallets:
- Digital wallets now account for around half of global online transactions. (Source: Statista.)
- Apple Pay leads the U.S. market with 43.9 million users, followed by the Starbucks wallet with 31.2 million. (Source: Business of Apps.)
- Worldwide, Apple Pay has 500+ million users and Google Pay exceeds 400 million. (Source: Business of Apps.)
Overall, the trend is clear: mobile dominates discovery and is steadily growing when it comes to share of purchases — with digital wallets removing friction and making mobile checkouts faster, safer, and more habitual.
Why do shoppers abandon their carts?
Cart abandonment remains one of the perennial challenges of ecommerce — and despite improvements in checkout design, payment tooling and delivery options, most shoppers still leave before completing their order. According to the latest Baymard Institute research, the average cart abandonment rate sits at 70.22%, meaning that only a minority of online shopping sessions ever translate into revenue.
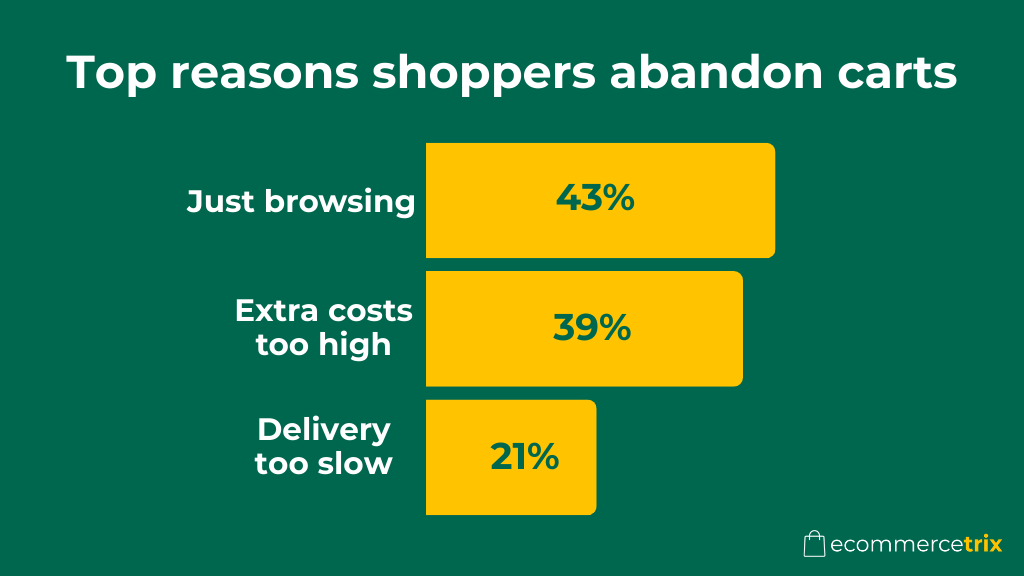
A big portion of this comes down to intent: 43% of shoppers say they were simply browsing and not yet ready to commit. But for those who did intend to buy, several avoidable friction points still push them away.
- 39% abandoned their purchase because extra costs — shipping, taxes, fees — were higher than expected. (Source: Baymard Institute.)
- 21% said the delivery timeline was too slow for their needs. (Source: Baymard Institute.)
- 19% didn’t trust the site with their credit card details. (Source: Baymard Institute.)
- 19% disliked being forced to create an account. (Source: Baymard Institute.)
- 18% felt the checkout process was too long or complicated. (Source: Baymard Institute.)
- 14% couldn’t see the full order cost upfront. (Source: Baymard Institute.)
- 10% wanted additional payment method options. (Source: Baymard Institute.)
This data highlights a familiar pattern: shoppers reward clarity, speed, and trust. And while you can’t entirely eliminate browsing-based abandonment, simplifying your checkout flow, being transparent about costs and offering secure, flexible payment options can meaningfully reduce the portion of customers who drop off for solvable reasons.
How widespread is ecommerce fraud?
Ecommerce fraud continues to rise, and its financial impact on merchants is becoming increasingly severe. Despite better tooling and stronger authentication methods, fraudsters are evolving just as quickly — creating a costly cycle of prevention, detection, and recovery for online retailers.
- Total ecommerce fraud losses climbed to $44.3 billion in 2024. (Source: Cropink.)
- For every $100 in fraudulent orders, merchants end up losing $207 once chargebacks, shipping costs, and operational overheads costsare factored in. (Source: Exploding Topics.)
- 29.8% of attacks involve account takeovers — a sign that credential theft and reused passwords remain major vulnerabilities. (Source: Finances Online.)
- 24.1% of fraud attempts come from bot-driven activity, highlighting the scale and automation behind modern fraud operations. (Source: Finances Online.)
- On the prevention side, around 60% of merchants now use payment tokenization, a significant step toward reducing exposure to sensitive card data. (Source: Merchant Risk Council.)
The takeaway: fraud isn’t just a background risk — it’s a rapidly growing cost center. For most merchants, investing in prevention tools, stronger identity checks and real-time monitoring is no longer optional.
Are dropshipping and print on demand still profitable?
Dropshipping and print-on-demand (POD) continue to attract new entrepreneurs for a simple reason: both models remain low-barrier, low-risk and, when executed well, reliably profitable. Recent data shows that neither trend is slowing down — in fact, both are expanding in size and sophistication.
- The global dropshipping market is valued at $372.47 billion in 2025, and is expected to reach $476.10 billion in 2026. (Source: Statista.)
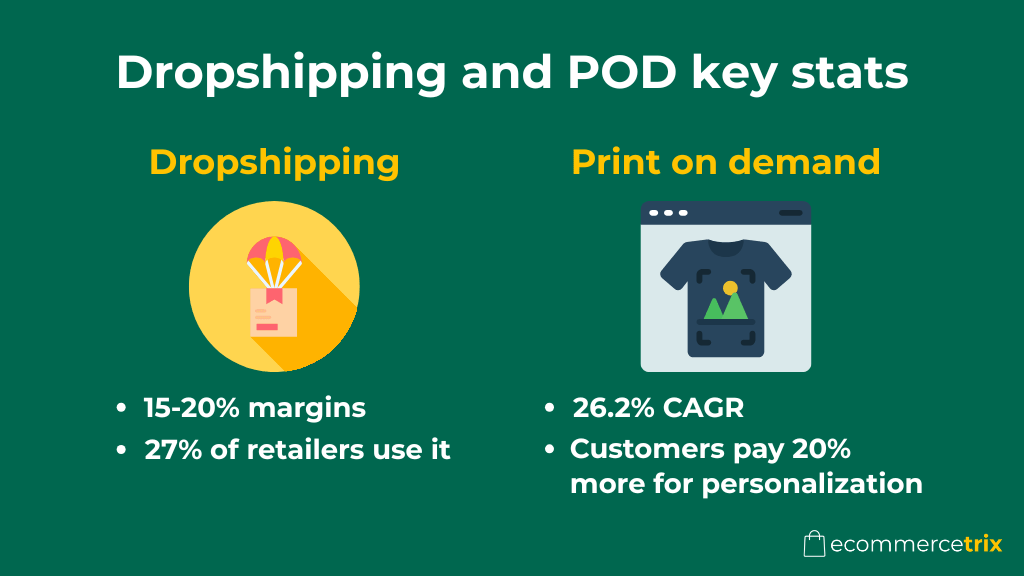
- Average dropshipping profit margins fall between 15%–20%, making it a viable option for lean, inventory-free businesses. (Source: BlueCart.)
- Approximately 27% of online retailers use dropshipping in some form. (Source: Ecommerce Platforms.)
- The ecosystem is broad: Shopify supports 638 dropshipping apps, WordPress 160, BigCommerce 28, and Wix 65. (Sources: Shopify, WordPress, BigCommerce, and Wix).
Print-on-demand is growing even faster:
- The POD market was worth $4.1 billion in 2021 and is projected to reach $39.87 billion by 2030 — with a compound annual growth rate (CAGR) of 26.2%. (Source: Straits Research.)
- Consumers are willing to pay 20% more for personalized POD products, making customization a major revenue lever. (Source: Com Cap.)
- Home decor is the fastest-growing POD category, reflecting strong demand for bespoke, design-led household items. (Source: Straits Research.)
Overall, both dropshipping and POD remain strong business models — not get-rich-quick schemes, but scalable, flexible approaches that continue to thrive as ecommerce consumers seek more variety, personalization and convenience.
How much is AI being used in ecommerce?
- The global AI market is projected to reach $757.6 billion in 2025 and expected to surpass $1.8 trillion by 2030.
- The AI-powered ecommerce tools market is projected to reach nearly $17 billion by 2030.
- The natural language processing (NLP) market is expected to exceed $112 billion by 2030, powered by increasingly accurate chatbots and search tools that better interpret customer intent.
- By 2030, AI is forecast to handle approximately 80% of customer interactions, reducing support workload while increasing response speed and consistency.
- AI-based product recommendation systems have been shown to increase revenue, conversion rates, and average order value, with some implementations reporting up to 3× revenue growth, 2× higher conversions, and 50% increases in order value.
- In 2025, 34% of US customers said they were comfortable in with the concept of agentic ecommerice — i.e., letting AI shop for them.

Source for above statistics: Shopify.
Where is ecommerce heading next?
Ecommerce isn’t just growing — it’s expanding into new behaviors, new devices, and entirely new environments. Over the next few years, online retail is expected to become even more deeply woven into everyday life, with shopping journeys taking place across voice interfaces, immersive digital spaces and a widening ecosystem of connected devices.
- By 2026, ecommerce is projected to account for 24% of all global retail, reflecting the steady shift away from traditional brick-and-mortar–only shopping. (Sources: IRP and Statista.)
- AI ecommerce looks set to rise: by 2030, AI is expected to manage 80% of customer interactions. (Source: Shopify.)
- Voice commerce is becoming a major part of that shift. Revenue from voice-activated shopping is expected to rise by $164 billion in 2024, fueled by increasing comfort with conversational interfaces. (Sources: Finances Online, Pew Research Center and Consulterce.)
- Meanwhile, metaverse-related ecommerce — still a relatively young segment — could grow from $30.6 billion to $678.8 billion, signaling a long-term move toward more immersive, blended online/virtual shopping experiences. (Source: Grand View Research.)
- Device adoption underpins all of this: 97% of people in the United States now own a smartphone, and 35% own a smart speaker, giving retailers more touchpoints than ever before. (Source: PEW Research Center.)
Taken together, these trends point to an ecommerce future defined not by a single platform or device, but by a fluid, multi-channel environment — one in which discovery, evaluation and purchase can happen anywhere a customer happens to be.
Other ecommerce resources from Ecommercetrix
I hope you’ve found this roundup of key ecommerce statistics helpful.
If you’d like to dig deeper into the platforms that power much of the industry, you might enjoy our in-depth reviews of Shopify, Squarespace, Wix, and Ecwid — each one explores the core features, strengths, and limitations of these leading store-building tools.
You might also like to read our Shopify statistics guide — it’s packed full of data about how this popular ecommerce platform is used, and how much market share it has.
And if you have any questions about the data in this post — or ecommerce trends more generally — feel free to leave a comment below. We’d love to help.
Get ecommerce news you can use
Sign up below and we’ll send you email digests of all the latest news and developments in the world of ecommerce, tips on how to grow an online business, and special offers.
Matt Walsh is the Head of Content at Ecommercetrix. He also creates video content for the site and its associated YouTube channel.
Having gained a degree in Literature and Philosophy from Trinity College Dublin and an MA in International Relations from Dublin City University, Matt worked in the marketing world for a decade before taking up an education role — teaching languages, literature and creative writing in London.
Matt is an Adobe Certified Associate in Photoshop and Illustrator, and also holds a certificate in digital marketing from DMI (Digital Marketing Institute), along with a postgraduate certificate in Design Thinking, Innovation, Entrepreneurship and Creative Thinking from Trinity College Dublin.